A place to ask questions and share ideas about all things related to trading
Bear Flags vs Bear Pennants (YT Short)
Today I posted the following YouTube short about the success rates of bear flags vs bear pennants. On average bear flags continue in the direction of the initial decline 68% of the time, whereas bear pennants only continue the trend 55% of the time. Given that many new traders confuse flags and pennants, knowing these stats changes the conviction you might have in a given trade.
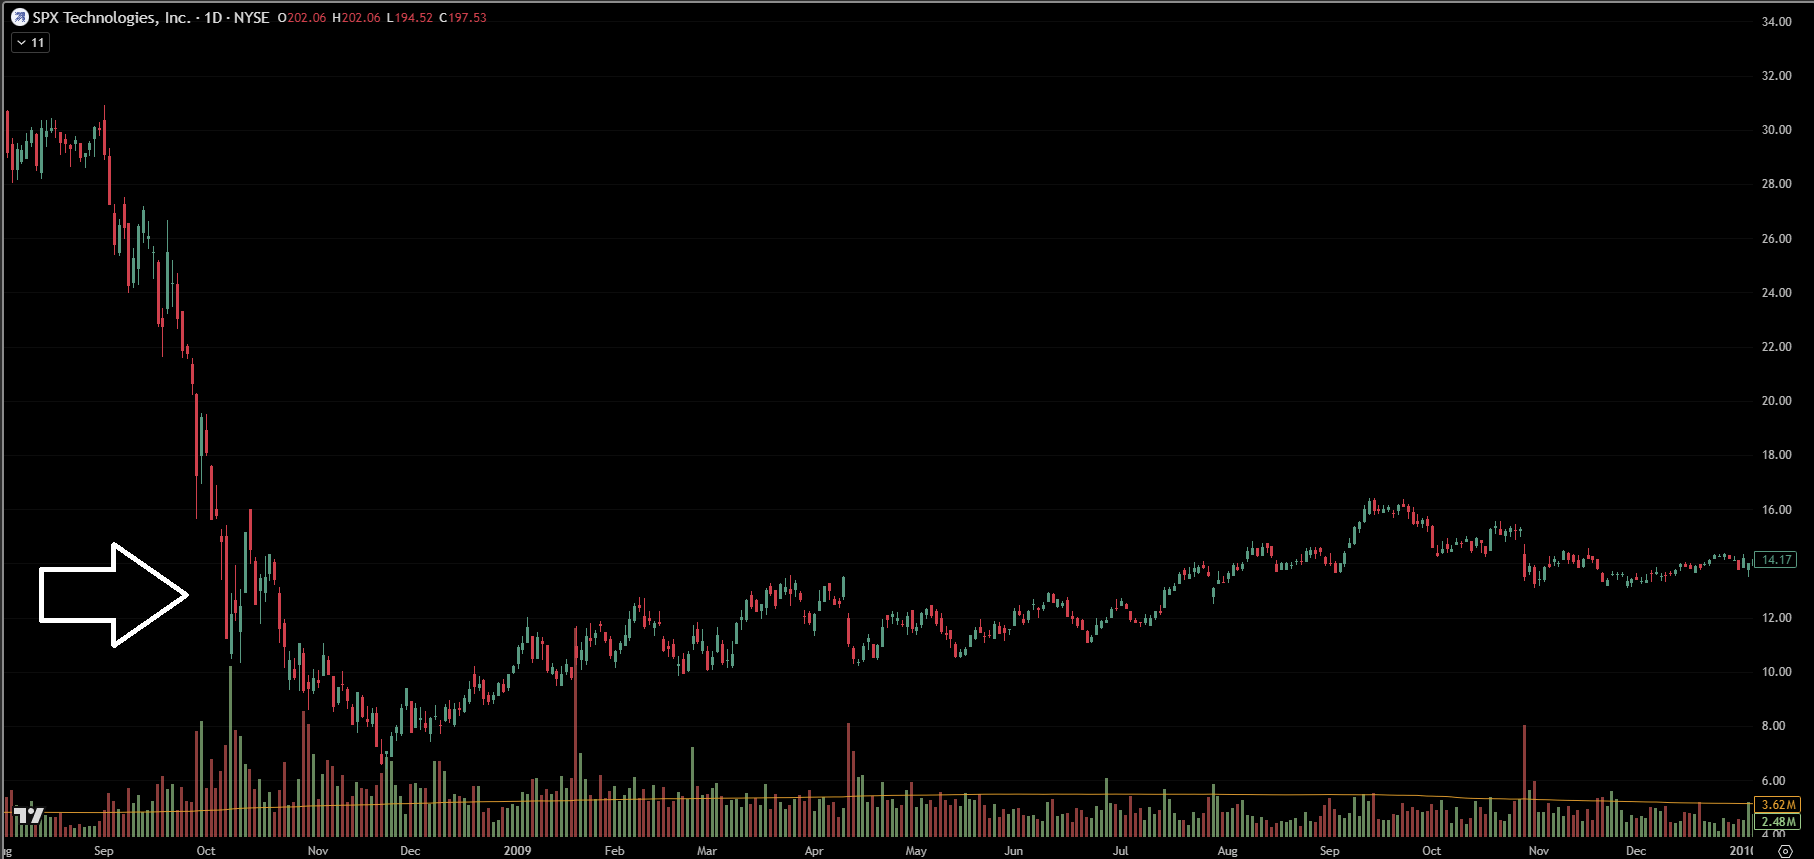
The stock shown in the video is SPX Technologies from Oct 2008. When I recorded the video, I took the trade in the simulator. It initially continued down, but it failed to reach my 1:2 risk reward price target. Since the simulator only shows you 200 days, it ended up turning into what looked like a bear flag pattern in which the bear pennant was part of it. However, when I went to look at the full chart, you can see it turned into a bottoming pattern.
- This topic has 0 replies, 1 voice, and was last updated 2 months, 2 weeks ago by
 .
.
- You must be logged in to reply to this topic.